Next.js Integration
Get started with OneMinute Logs in your Next.js application. Monitor your app with real-time logging, metrics, and alerts in under a minute.
Installation
Install the OneMinute Logs SDK using your preferred package manager.
npm i @oneminutelogs/nextor
yarn add @oneminutelogs/nextConfiguration
Create a new file at src/lib/oneminutelogs.ts to initialize the logger.
import { createLogger } from "@oneminutelogs/next";

export const log = createLogger({
  apiKey: process.env.ONE_MINUTE_LOGS_API_KEY!,
  appName: process.env.ONE_MINUTE_LOGS_APP_NAME!,
  environment: process.env.ONE_MINUTE_LOGS_ENVIRONMENT || "development",
});
API Keys
To get your API key:
- Go to oneminutelogs.com and create a free account.
- Navigate to the Dashboard.
- Go to the API Keys section.
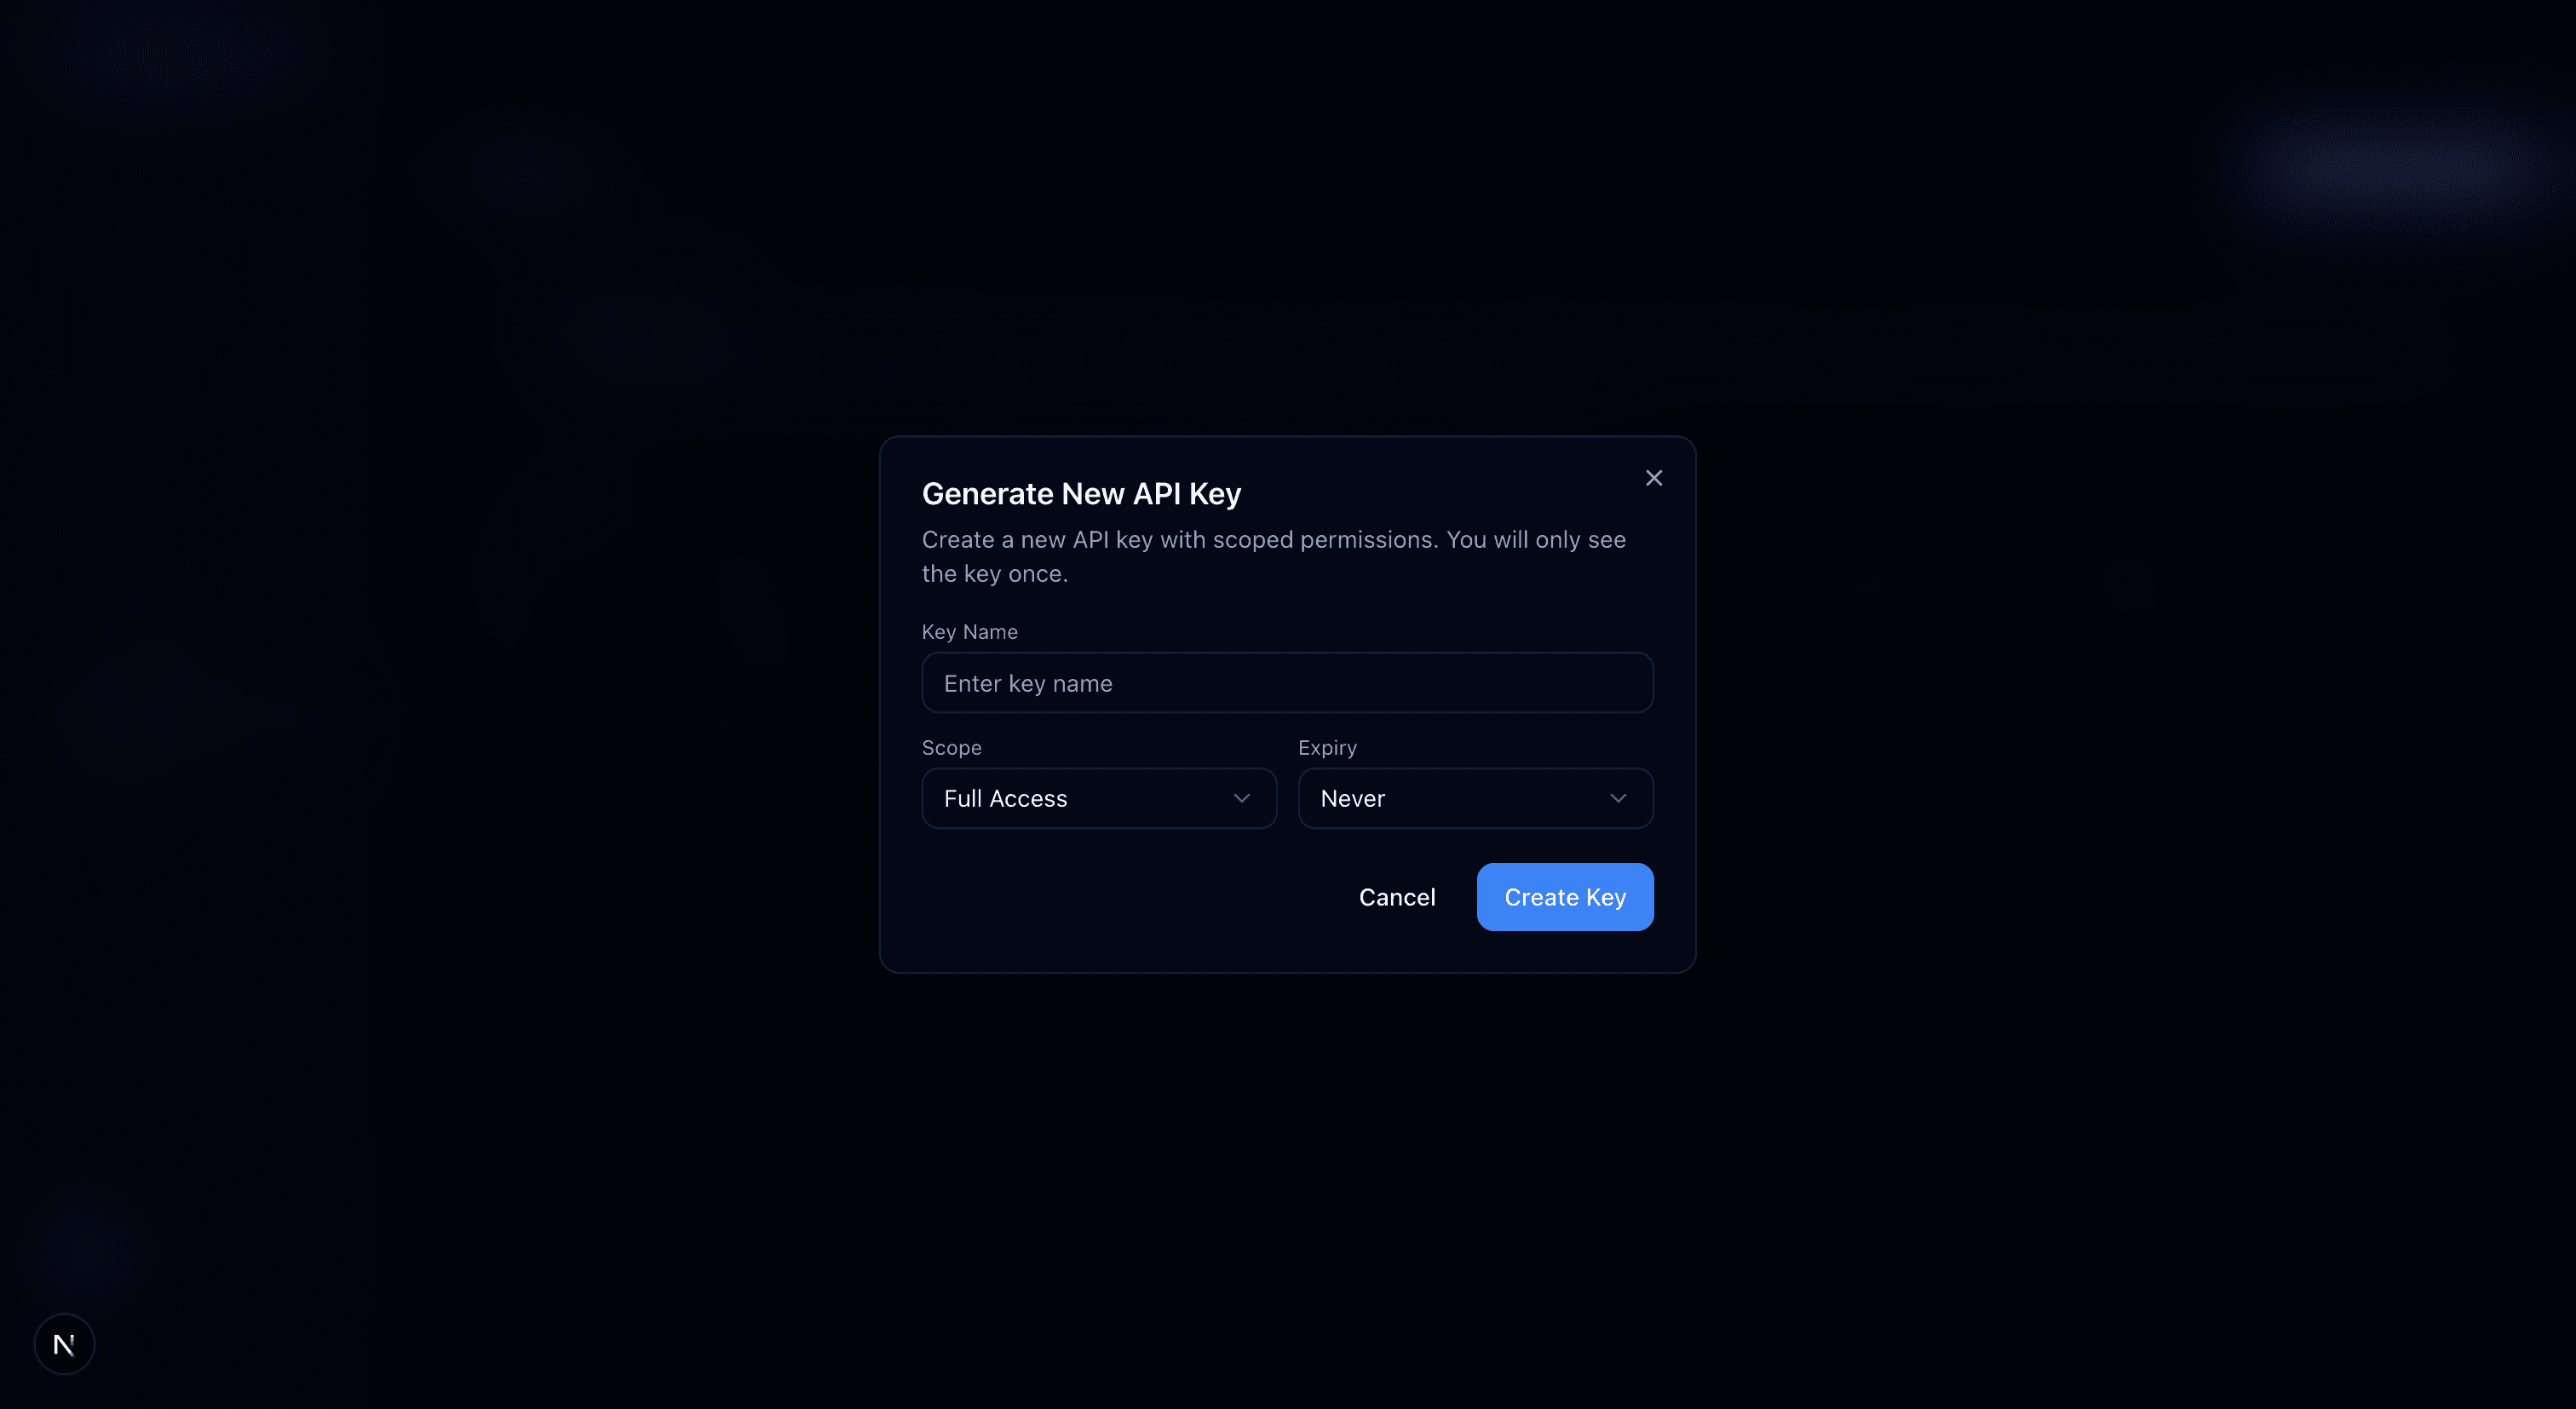
- Click Generate New Key.
- Configure Key Details:
- Key Name: Enter a name relevant to your project.
- Scope: Defines the key's permissions.
- Full Access (Recommended): Allows sending and retrieving logs from your backend.
- Read Only: Only for previewing/retrieving logs.
- Write Only: Only for storing/sending logs.
- Expiry: Select Never (Recommended), 30 days, or 90 days.

Note: Keep your API key secure. Do not expose it in client-side code unless necessary (use environment variables).
Storing Logs - Only For Server-Side
OneMinute Logs provides a flexible API to store logs ranging from simple messages to complex, structured events with metrics and security context.
Available Log Types
OneMinute Logs supports the following log types, each with its own method:
log.info()General informational messages
log.warning()Warning messages for potential issues
log.error()Error messages for failures
log.debug()Debug information for development
log.audit()Audit trail for security events
log.metric()Performance metrics and measurements
1. Simple Logging
The most basic way to log an event is to send a simple message. This is useful for general information or quick debugging.
import { log } from "@/lib/oneminutelogs";

// Basic info log
await log.info({
  message: "Server started successfully"
});

// Basic error log
await log.error({
  message: "Failed to connect to database"
});
2. Adding Context
Add context to your logs to make them more actionable. You can specify the importance of the event and the subsystem it originated from.
await log.warning({
  message: "High memory usage detected",
  importance: "high",      // critical, high, medium, low
  subsystem: "cache",      // db, cache, queue, network
  operation: "cleanup"     // Custom operation name
});
3. Tracking User Activity
Attach user information to logs to track who performed an action. The track object allows you to log user IDs, roles, and other session details.
await log.info({
  message: "User updated profile",
  track: {
    user_id: "usr_123456",
    role: "admin",
    user_agent: "Mozilla/5.0...", // Optional
    ip: "192.168.1.1"             // Optional
  }
});
4. Security Events
Log security-related events like authentication attempts or suspicious activities using the security object.
await log.audit({
  message: "Failed login attempt",
  security: {
    auth_status: "failed", // success, failed, expired
    suspicious: true,
    tags: ["brute-force", "login"]
  },
  track: {
    ip: "203.0.113.42"
  }
});
5. Performance Metrics
Track performance data alongside your logs using the metrics object. This is perfect for monitoring latency, database queries, or custom counters.
await log.metric({
  message: "API Request processed",
  metrics: {
    latency_ms: 145,
    db_query_count: 3
  },
  subsystem: "db"
});
Full Complex Example
Combine all parameters for a comprehensive log entry that gives you full visibility into an event.
await log.error({
  message: "Payment transaction failed",
  importance: "critical",
  subsystem: "db",
  operation: "process_payment",
  service: "payment",
  track: {
    user_id: "usr_98765",
    role: "user"
  },
  metrics: {
    latency_ms: 2500,
    db_query_count: 12
  },
  security: {
    tags: ["payment-error", "timeout"]
  }
});
Log Parameters
| Parameter | Type | Required | Description |
|---|---|---|---|
| message | string | Yes | The main log message describing the event. |
| importance | "critical" | "high" | "medium" | "low" | No | Severity level of the event. |
| subsystem | "db" | "cache" | "queue" | "network" | No | The system component where the event originated. |
| operation | string | No | Name of the specific operation or function (e.g., "process_payment"). |
| service | string | No | Microservice or service name (e.g., "payment-service"). |
| track | object | No | User tracking details. Properties: user_id, role, ip, user_agent |
| security | object | No | Security context. Properties: auth_status, suspicious, tags |
| metrics | object | No | Performance metrics. Properties: latency_ms, db_query_count |
If you have any questions or concerns feel free to reach contact@oneminutestack.com